|
|
|
|
|
|
Catillon-sur-Sambre population statistics
|
|
|
|
Historical data of the population of Catillon-sur-Sambre from 1968 to 2007
Historical data of the population of Catillon-sur-Sambre from 1968 to 2007 :
Population of Catillon-sur-Sambre was 865 inhabitants in 2007, 846 inhabitants in 1999, 926 inhabitants in 1990, 1 012 inhabitants in 1982, 1 096 inhabitants in 1975 and 1 105 inhabitants in 1968.
This population Census of the town of Catillon-sur-Sambre was made without duplicated data, which means that each Catillon-sur-Sambre resident that have ties to another municipality is counted only once for the two municipalities.
|
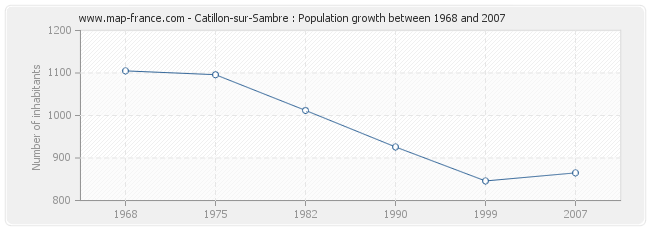
Population Catillon-sur-Sambre
|
Population distribution of Catillon-sur-Sambre by sexe
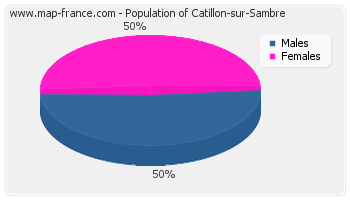
Population distribution of Catillon-sur-Sambre by sexe :
- Men inhabitants Catillon-sur-Sambre in 2007 were 436
- Women inhabitants in 2007 were 429
|
|
Evolution of the population of Catillon-sur-Sambre
|
Population of Catillon-sur-Sambre from 1968 to 2007 :
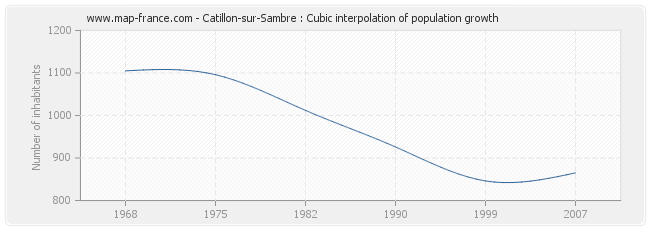
This curve shows the history of the population of Catillon-sur-Sambre from 1968 to 2007 in cubic interpolation. This provides more precisely the population of the municipality of Catillon-sur-Sambre the years where no census has been taken.
- Population of Catillon-sur-Sambre in 2007 : 865 inhabitants
- Population of Catillon-sur-Sambre in 1999 : 846 inhabitants
- Population of Catillon-sur-Sambre in 1990 : 926 inhabitants
- Population of Catillon-sur-Sambre in 1982 : 1 012 inhabitants
- Population of Catillon-sur-Sambre in 1975 : 1 096 inhabitants
- Population of Catillon-sur-Sambre in 1968 : 1 105 inhabitants
|
|
Catillon-sur-Sambre : births and deaths
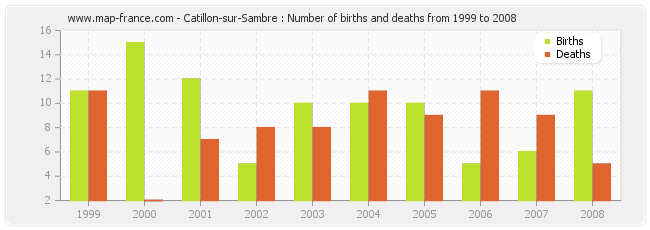
Catillon-sur-Sambre : births and deaths from 1999 to 2008
- Catillon-sur-Sambre in 2008 : 11 births and 5 deaths
- Catillon-sur-Sambre in 2007 : 6 births and 9 deaths
- Catillon-sur-Sambre in 2006 : 5 births and 11 deaths
- Catillon-sur-Sambre in 2005 : 10 births and 9 deaths
- Catillon-sur-Sambre in 2004 : 10 births and 11 deaths
- Catillon-sur-Sambre in 2003 : 10 births and 8 deaths
- Catillon-sur-Sambre in 2002 : 5 births and 8 deaths
- Catillon-sur-Sambre in 2001 : 12 births and 7 deaths
- Catillon-sur-Sambre in 2000 : 15 births and 2 deaths
- Catillon-sur-Sambre in 1999 : 11 births and 11 deaths
|
|
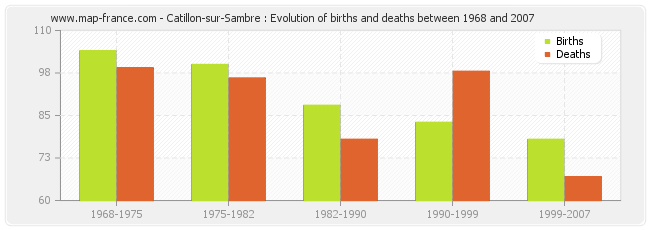
Catillon-sur-Sambre : evolution of births and deaths from 1968 to 2007
- From 1999 and 2007 : 78 births and 67 deaths.
- From 1990 and 1999 : 83 births and 98 deaths.
- From 1982 and 1990 : 88 births and 78 deaths.
- From 1975 and 1982 : 100 births and 96 deaths.
- From 1968 and 1975 : 104 births and 99 deaths.
|
|
Distribution of the population of Catillon-sur-Sambre by age
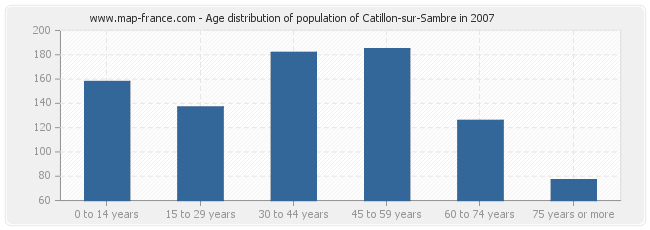
Distribution of the population of Catillon-sur-Sambre by age in 2007 :
- Population of Catillon-sur-Sambre from 0 to 14 years : 158 inhabitants
- Population of Catillon-sur-Sambre from 15 to 29 years : 137 inhabitants
- Population of Catillon-sur-Sambre from 30 to 44 years : 182 inhabitants
- Population of Catillon-sur-Sambre from 45 to 59 years : 185 inhabitants
- Population of Catillon-sur-Sambre from 60 to 74 years : 126 inhabitants
- Population of Catillon-sur-Sambre from 75 years or more : 77 inhabitants
|
|
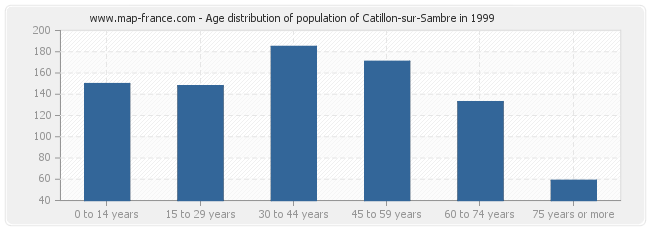
Distribution of the population of Catillon-sur-Sambre by age in 1999 :
- Population of Catillon-sur-Sambre from 0 to 14 years : 150 inhabitants
- Population of Catillon-sur-Sambre from 15 to 29 years : 148 inhabitants
- Population of Catillon-sur-Sambre from 30 to 44 years : 185 inhabitants
- Population of Catillon-sur-Sambre from 45 to 59 years : 171 inhabitants
- Population of Catillon-sur-Sambre from 60 to 74 years : 133 inhabitants
- Population of Catillon-sur-Sambre from 75 years or more : 59 inhabitants
|
|
Men population of Catillon-sur-Sambre in 2007
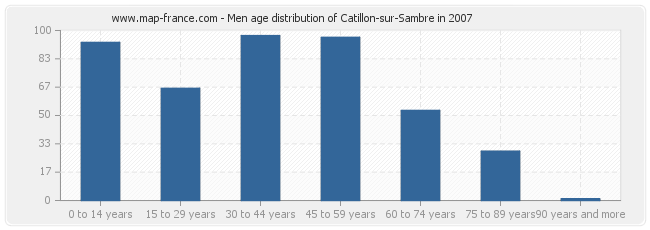
Men population distribution of Catillon-sur-Sambre by age in 2007 :
- Catillon-sur-Sambre men inhabitants from 0 to 14 years : 93
- Catillon-sur-Sambre men inhabitants from 15 to 29 years : 66
- Catillon-sur-Sambre men inhabitants from 30 to 44 years : 97
- Catillon-sur-Sambre men inhabitants from 45 to 59 years : 96
- Catillon-sur-Sambre men inhabitants from 60 to 74 years : 53
- Catillon-sur-Sambre men inhabitants from 75 to 90 years : 29
- Catillon-sur-Sambre men inhabitants of 90 years and more : 1
|
|
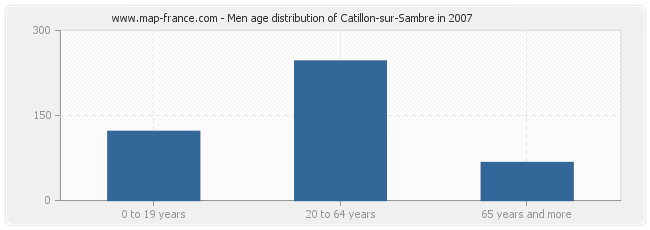
Men population distribution of Catillon-sur-Sambre by age in 2007 :
- Catillon-sur-Sambre men inhabitants from 0 to 19 years : 122
- Catillon-sur-Sambre men inhabitants from 20 to 64 years : 246
- Catillon-sur-Sambre men inhabitants of 65 years and more : 67
|
|
Population féminine of Catillon-sur-Sambre in 2007
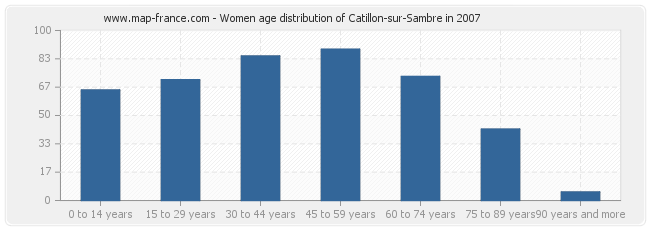
Women population distribution of Catillon-sur-Sambre by age in 2007 :
- Catillon-sur-Sambre women inhabitants from 0 to 14 years : 65
- Catillon-sur-Sambre women inhabitants from 15 to 29 years : 71
- Catillon-sur-Sambre women inhabitants from 30 to 44 years : 85
- Catillon-sur-Sambre women inhabitants from 45 to 59 years : 89
- Catillon-sur-Sambre women inhabitants from 60 to 74 years : 73
- Catillon-sur-Sambre women inhabitants from 75 to 90 years : 42
- Catillon-sur-Sambre women inhabitants of 90 years and more : 5
|
|
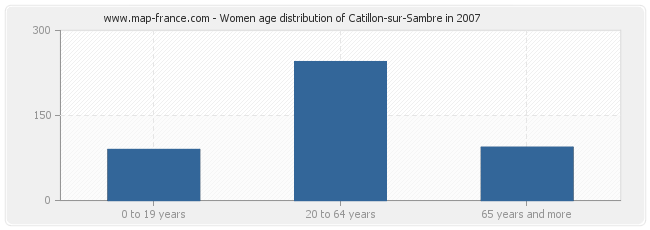
Women population distribution of Catillon-sur-Sambre by age in 2007 :
- Catillon-sur-Sambre women inhabitants from 0 to 19 years : 90
- Catillon-sur-Sambre women inhabitants from 20 to 64 years : 245
- Catillon-sur-Sambre women inhabitants of 65 years and more : 94
|
|
|
Other population statistics, maps, hotels of towns in france
Find the population data of another town, zip code, department, region, ...
Quick links Catillon-sur-Sambre :
Back to the menus Map of France :
Make a link to this page of Catillon-sur-Sambre with the following code :
|
|
Map of France | Regions | Departments | Cities | Partners | Terms | Contact
|


