Evolution of the number of housing of Chevillon-sur-Huillard
History of housing of Chevillon-sur-Huillard from 1968 to 2007 :
The number of housing of Chevillon-sur-Huillard was 567 in 2007, 518 in 1999, 524 in 1990, 473 in 1982, 345 in 1975 and 266 in 1968.
In 2007 the accommodations of Chevillon-sur-Huillard consisted of 501 main homes, 39 second homes and 27 vacant accommodations.
The following graphs show the history of the number and the type of housing of Chevillon-sur-Huillard from 1968 to 2007. The second graph is drawn in cubic interpolation. This allows to obtain more exactly the number of accommodation of the town of Chevillon-sur-Huillard years where no inventory was made.
|
Housing of Chevillon-sur-Huillard from 1968 to 2007 :
- Housing of Chevillon-sur-Huillard in 2007 : 567
- Housing of Chevillon-sur-Huillard in 1999 : 518
- Housing of Chevillon-sur-Huillard in 1990 : 524
- Housing of Chevillon-sur-Huillard in 1982 : 473
- Housing of Chevillon-sur-Huillard in 1975 : 345
- Housing of Chevillon-sur-Huillard in 1968 : 266
|
Number of housing of Chevillon-sur-Huillard group by types from 1968 to 2007 :
- Number of main homes of Chevillon-sur-Huillard in 2007 : 501
- Number of main homes of Chevillon-sur-Huillard in 1999 : 432
- Number of main homes of Chevillon-sur-Huillard in 1990 : 384
- Number of second homes of Chevillon-sur-Huillard in 2007 : 39
- Number of second homes of Chevillon-sur-Huillard in 1999 : 68
- Number of second homes of Chevillon-sur-Huillard in 1990 : 107
- Number of vacant housing of Chevillon-sur-Huillard in 2007 : 27
- Number of vacant housing of Chevillon-sur-Huillard in 1999 : 18
- Number of vacant housing of Chevillon-sur-Huillard in 1990 : 33
|
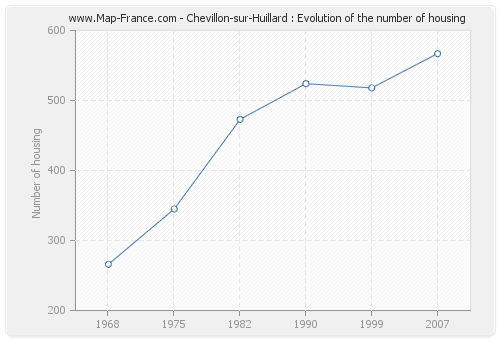
Housing of Chevillon-sur-Huillard
|
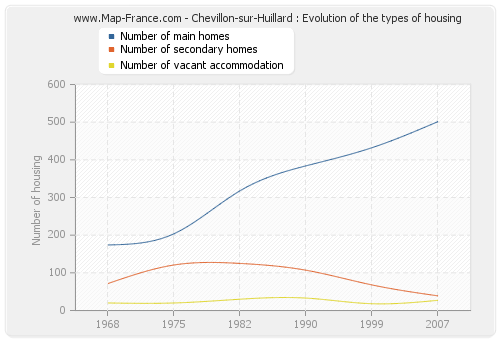
Housing evolution of Chevillon-sur-Huillard from 1968 to 2007
|
Number of housing of Chevillon-sur-Huillard per inhabitants
History of the number of housing of Chevillon-sur-Huillard per inhabitants :
The population of Chevillon-sur-Huillard was 1 237 inhabitants in 2007, 1 141 inhabitants in 1999, 1 043 inhabitants in 1990, 901 inhabitants in 1982, 636 inhabitants in 1975 and 481 inhabitants in 1968. Meanwhile, the number of housing of Chevillon-sur-Huillard was 567 in 2007, 518 in 1999, 524 in 1990, 473 in 1982, 345 in 1975 and 266 in 1968.
The number of inhabitants of Chevillon-sur-Huillard per housing was 2,18 in 2007.
|
Population of Chevillon-sur-Huillard from 1968 to 2007 :
- Population of Chevillon-sur-Huillard in 2007 : 1 237 inhabitants
- Population of Chevillon-sur-Huillard in 1999 : 1 141 inhabitants
- Population of Chevillon-sur-Huillard in 1990 : 1 043 inhabitants
- Population of Chevillon-sur-Huillard in 1982 : 901 inhabitants
- Population of Chevillon-sur-Huillard in 1975 : 636 inhabitants
- Population of Chevillon-sur-Huillard in 1968 : 481 inhabitants
|
Number of inhabitants per housing of Chevillon-sur-Huillard :
- Number of inhabitants per housing of Chevillon-sur-Huillard in 2007 : 2,18
- Number of inhabitants per housing of Chevillon-sur-Huillard in 1999 : 2,20
- Number of inhabitants per housing of Chevillon-sur-Huillard in 1990 : 1,99
- Number of inhabitants per housing of Chevillon-sur-Huillard in 1982 : 1,90
- Number of inhabitants per housing of Chevillon-sur-Huillard in 1975 : 1,84
- Number of inhabitants per housing of Chevillon-sur-Huillard in 1968 : 1,81
|
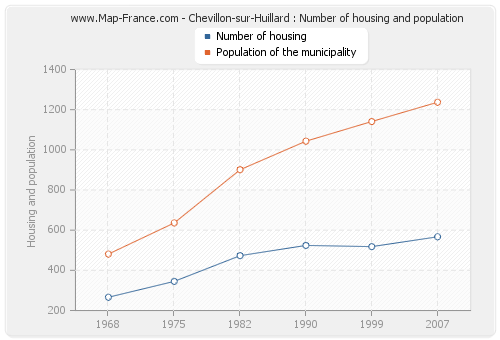
Number of inhabitants and housing of Chevillon-sur-Huillard
|
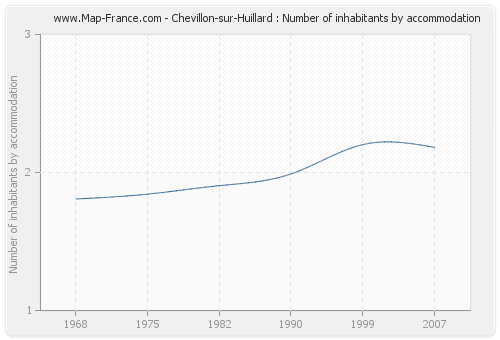
Number of inhabitants per housing of Chevillon-sur-Huillard
|
Type of accommodation of Chevillon-sur-Huillard
The accommodation of Chevillon-sur-Huillard in 2007 consisted of 562 houses and 5 flats.
Here are below the graphs presenting the statistics of housing of Chevillon-sur-Huillard.
|
Type of housing of Chevillon-sur-Huillard in 2007 :
- Number of houses of Chevillon-sur-Huillard in 2007 : 562
- Number of apartments of Chevillon-sur-Huillard in 2007 : 5 |
Number of rooms of main homes of Chevillon-sur-Huillard in 2007 :
- Number of main homes of Chevillon-sur-Huillard of 1 room : 0
- Number of main homes of Chevillon-sur-Huillard of 2 rooms : 16
- Number of main homes of Chevillon-sur-Huillard of 3 rooms : 74
- Number of main homes of Chevillon-sur-Huillard of 4 rooms : 74
- Number of main homes of Chevillon-sur-Huillard of 5 rooms and more : 301 |
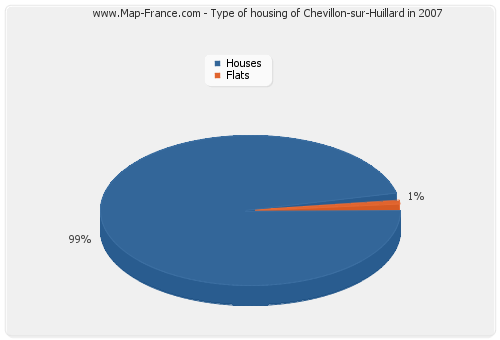
Type of housing of Chevillon-sur-Huillard in 2007
|
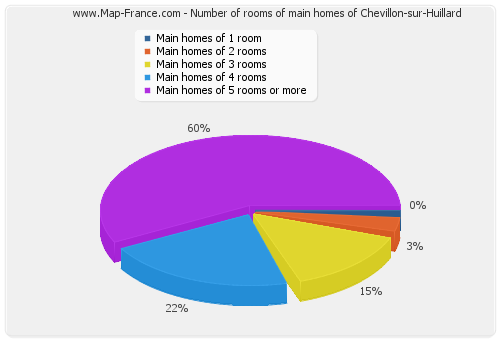
Number of rooms of main homes of Chevillon-sur-Huillard
|
Type of housing of Chevillon-sur-Huillard
|
In 2007, 447 main homes of Chevillon-sur-Huillard were occupied by owners. Meanwhile, 501 households lived in the town of Chevillon-sur-Huillard. The following graphs present the statistics of these households of Chevillon-sur-Huillard.
|
Moving in date of the households of Chevillon-sur-Huillard (2007 data):
- Number of households of Chevillon-sur-Huillard having moved for less than 2 years : 33
- Number of households of Chevillon-sur-Huillard having moved between 2 and 5 years : 65
- Number of households of Chevillon-sur-Huillard having moved between 5 and 9 years : 89
- Number of households of Chevillon-sur-Huillard having moved for 10 years or more : 315 |
Type of housing of the main homes of Chevillon-sur-Huillard in 2007 :
- Number of main homes of Chevillon-sur-Huillard occupied by owners : 447
- Number of main homes of Chevillon-sur-Huillard occupied by tenants : 47
- Number of main homes of Chevillon-sur-Huillard occupied free of charge : 8 |
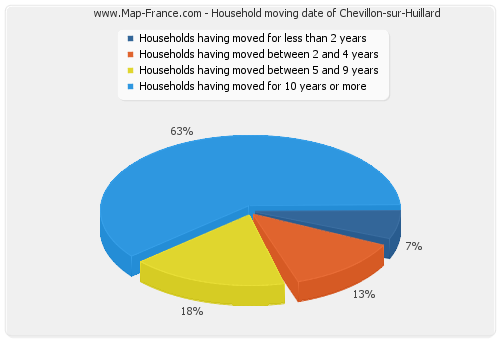
Household moving date of Chevillon-sur-Huillard
|
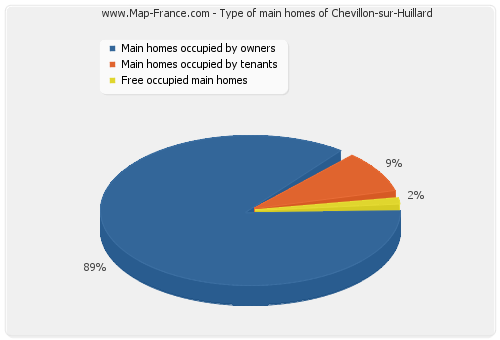
Type of main homes of Chevillon-sur-Huillard
|
|
