|
|
|
|
|
|
Horbourg-Wihr population statistics
|
|
|
|
Historical data of the population of Horbourg-Wihr from 1968 to 2007
Historical data of the population of Horbourg-Wihr from 1968 to 2007 :
Population of Horbourg-Wihr was 5 005 inhabitants in 2007, 5 059 inhabitants in 1999, 4 518 inhabitants in 1990, 4 209 inhabitants in 1982, 2 720 inhabitants in 1975 and 2 057 inhabitants in 1968.
This population Census of the city of Horbourg-Wihr was made without duplicated data, which means that each Horbourg-Wihr resident that have ties to another municipality is counted only once for the two municipalities.
|
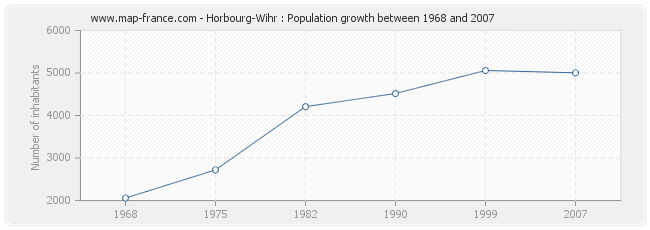
Population Horbourg-Wihr
|
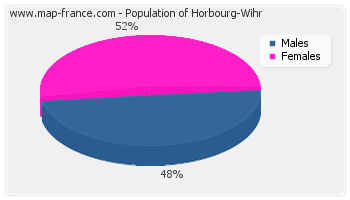
Population distribution of Horbourg-Wihr by sexe
Population distribution of Horbourg-Wihr by sexe :
- Men inhabitants Horbourg-Wihr in 2007 were 2 416
- Women inhabitants in 2007 were 2 588
|
|
Evolution of the population of Horbourg-Wihr
|
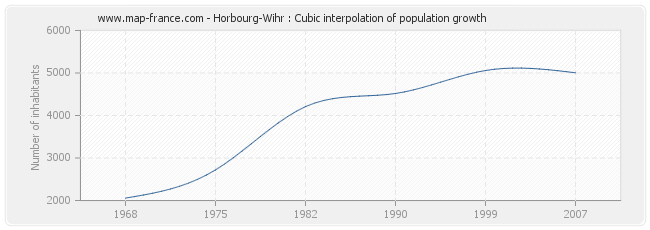
Population of Horbourg-Wihr from 1968 to 2007 :
This curve shows the history of the population of Horbourg-Wihr from 1968 to 2007 in cubic interpolation. This provides more precisely the population of the municipality of Horbourg-Wihr the years where no census has been taken.
- Population of Horbourg-Wihr in 2007 : 5 005 inhabitants
- Population of Horbourg-Wihr in 1999 : 5 059 inhabitants
- Population of Horbourg-Wihr in 1990 : 4 518 inhabitants
- Population of Horbourg-Wihr in 1982 : 4 209 inhabitants
- Population of Horbourg-Wihr in 1975 : 2 720 inhabitants
- Population of Horbourg-Wihr in 1968 : 2 057 inhabitants
|
|
Horbourg-Wihr : births and deaths
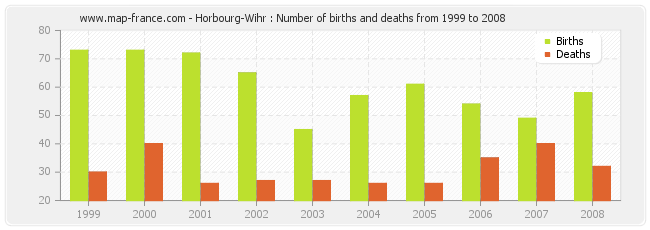
Horbourg-Wihr : births and deaths from 1999 to 2008
- Horbourg-Wihr in 2008 : 58 births and 32 deaths
- Horbourg-Wihr in 2007 : 49 births and 40 deaths
- Horbourg-Wihr in 2006 : 54 births and 35 deaths
- Horbourg-Wihr in 2005 : 61 births and 26 deaths
- Horbourg-Wihr in 2004 : 57 births and 26 deaths
- Horbourg-Wihr in 2003 : 45 births and 27 deaths
- Horbourg-Wihr in 2002 : 65 births and 27 deaths
- Horbourg-Wihr in 2001 : 72 births and 26 deaths
- Horbourg-Wihr in 2000 : 73 births and 40 deaths
- Horbourg-Wihr in 1999 : 73 births and 30 deaths
|
|
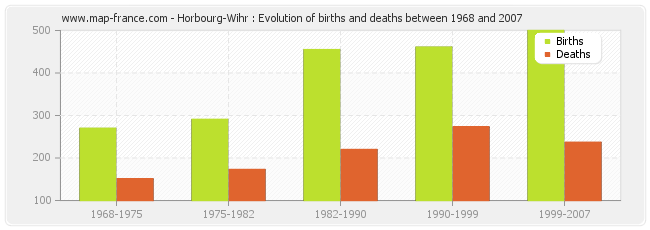
Horbourg-Wihr : evolution of births and deaths from 1968 to 2007
- From 1999 and 2007 : 500 births and 237 deaths.
- From 1990 and 1999 : 461 births and 273 deaths.
- From 1982 and 1990 : 455 births and 220 deaths.
- From 1975 and 1982 : 291 births and 173 deaths.
- From 1968 and 1975 : 270 births and 151 deaths.
|
|
Distribution of the population of Horbourg-Wihr by age
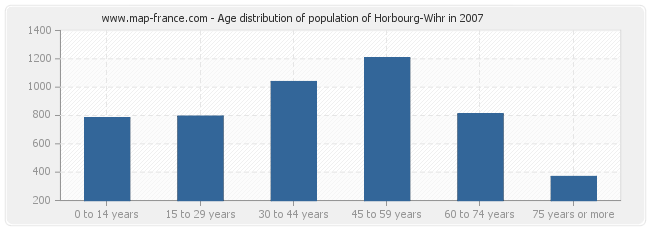
Distribution of the population of Horbourg-Wihr by age in 2007 :
- Population of Horbourg-Wihr from 0 to 14 years : 784 inhabitants
- Population of Horbourg-Wihr from 15 to 29 years : 795 inhabitants
- Population of Horbourg-Wihr from 30 to 44 years : 1 039 inhabitants
- Population of Horbourg-Wihr from 45 to 59 years : 1 206 inhabitants
- Population of Horbourg-Wihr from 60 to 74 years : 811 inhabitants
- Population of Horbourg-Wihr from 75 years or more : 369 inhabitants
|
|
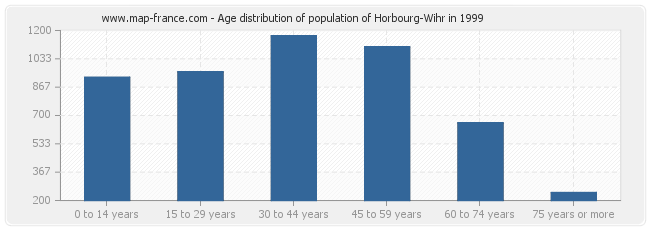
Distribution of the population of Horbourg-Wihr by age in 1999 :
- Population of Horbourg-Wihr from 0 to 14 years : 925 inhabitants
- Population of Horbourg-Wihr from 15 to 29 years : 957 inhabitants
- Population of Horbourg-Wihr from 30 to 44 years : 1 169 inhabitants
- Population of Horbourg-Wihr from 45 to 59 years : 1 104 inhabitants
- Population of Horbourg-Wihr from 60 to 74 years : 657 inhabitants
- Population of Horbourg-Wihr from 75 years or more : 247 inhabitants
|
|
Men population of Horbourg-Wihr in 2007
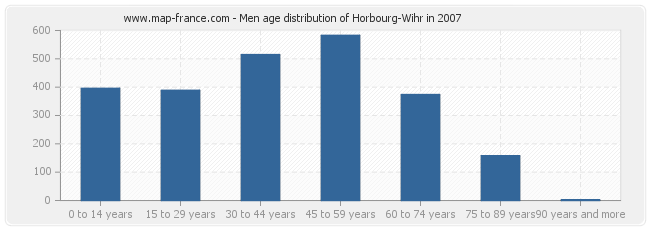
Men population distribution of Horbourg-Wihr by age in 2007 :
- Horbourg-Wihr men inhabitants from 0 to 14 years : 396
- Horbourg-Wihr men inhabitants from 15 to 29 years : 389
- Horbourg-Wihr men inhabitants from 30 to 44 years : 515
- Horbourg-Wihr men inhabitants from 45 to 59 years : 583
- Horbourg-Wihr men inhabitants from 60 to 74 years : 374
- Horbourg-Wihr men inhabitants from 75 to 90 years : 158
- Horbourg-Wihr men inhabitants of 90 years and more : 2
|
|
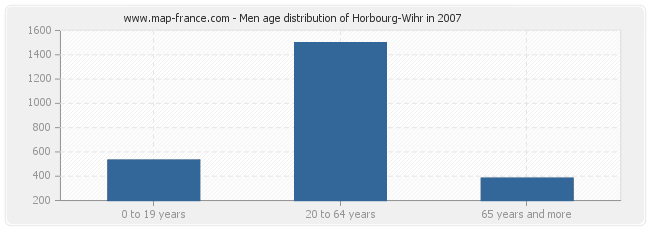
Men population distribution of Horbourg-Wihr by age in 2007 :
- Horbourg-Wihr men inhabitants from 0 to 19 years : 533
- Horbourg-Wihr men inhabitants from 20 to 64 years : 1 499
- Horbourg-Wihr men inhabitants of 65 years and more : 384
|
|
Population féminine of Horbourg-Wihr in 2007
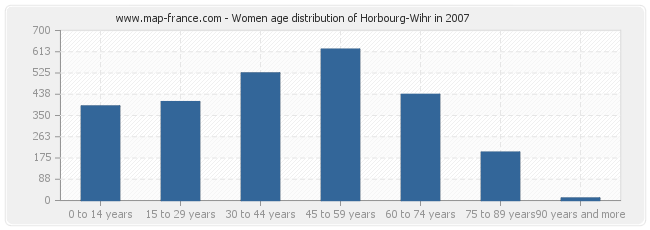
Women population distribution of Horbourg-Wihr by age in 2007 :
- Horbourg-Wihr women inhabitants from 0 to 14 years : 389
- Horbourg-Wihr women inhabitants from 15 to 29 years : 407
- Horbourg-Wihr women inhabitants from 30 to 44 years : 525
- Horbourg-Wihr women inhabitants from 45 to 59 years : 623
- Horbourg-Wihr women inhabitants from 60 to 74 years : 437
- Horbourg-Wihr women inhabitants from 75 to 90 years : 199
- Horbourg-Wihr women inhabitants of 90 years and more : 10
|
|
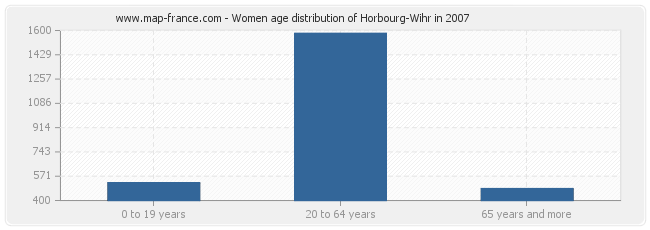
Women population distribution of Horbourg-Wihr by age in 2007 :
- Horbourg-Wihr women inhabitants from 0 to 19 years : 525
- Horbourg-Wihr women inhabitants from 20 to 64 years : 1 580
- Horbourg-Wihr women inhabitants of 65 years and more : 484
|
|
|
Other population statistics, maps, hotels of towns in france
Find the population data of another town, zip code, department, region, ...
Quick links Horbourg-Wihr :
Back to the menus Map of France :
Make a link to this page of Horbourg-Wihr with the following code :
|
|
Map of France | Regions | Departments | Cities | Partners | Terms | Contact
|
