Evolution of the number of housing of Le Morne-Rouge
History of housing of Le Morne-Rouge from 1968 to 2007 :
The number of housing of Le Morne-Rouge was 2 445 in 2007, 2 060 in 1999, 1 788 in 1990, 1 641 in 1982, 1 503 in 1975 and 1 389 in 1968.
In 2007 the accommodations of Le Morne-Rouge consisted of 1 901 main homes, 97 second homes and 448 vacant accommodations.
The following graphs show the history of the number and the type of housing of Le Morne-Rouge from 1968 to 2007. The second graph is drawn in cubic interpolation. This allows to obtain more exactly the number of accommodation of the city of Le Morne-Rouge years where no inventory was made.
|
Housing of Le Morne-Rouge from 1968 to 2007 :
- Housing of Le Morne-Rouge in 2007 : 2 445
- Housing of Le Morne-Rouge in 1999 : 2 060
- Housing of Le Morne-Rouge in 1990 : 1 788
- Housing of Le Morne-Rouge in 1982 : 1 641
- Housing of Le Morne-Rouge in 1975 : 1 503
- Housing of Le Morne-Rouge in 1968 : 1 389
|
Number of housing of Le Morne-Rouge group by types from 1968 to 2007 :
- Number of main homes of Le Morne-Rouge in 2007 : 1 901
- Number of main homes of Le Morne-Rouge in 1999 : 1 762
- Number of main homes of Le Morne-Rouge in 1990 : 1 571
- Number of second homes of Le Morne-Rouge in 2007 : 97
- Number of second homes of Le Morne-Rouge in 1999 : 71
- Number of second homes of Le Morne-Rouge in 1990 : 95
- Number of vacant housing of Le Morne-Rouge in 2007 : 448
- Number of vacant housing of Le Morne-Rouge in 1999 : 227
- Number of vacant housing of Le Morne-Rouge in 1990 : 122
|
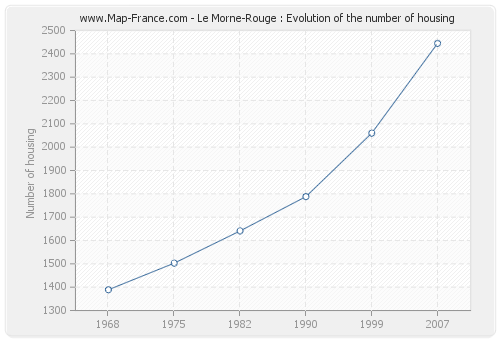
Housing of Le Morne-Rouge
|
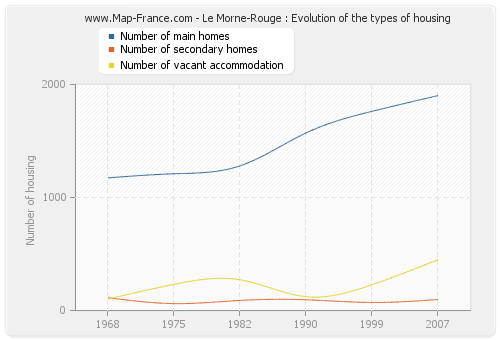
Housing evolution of Le Morne-Rouge from 1968 to 2007
|
Number of housing of Le Morne-Rouge per inhabitants
History of the number of housing of Le Morne-Rouge per inhabitants :
The population of Le Morne-Rouge was 5 170 inhabitants in 2007, 5 392 inhabitants in 1999, 5 278 inhabitants in 1990, 4 889 inhabitants in 1982, 5 412 inhabitants in 1975 and 5 449 inhabitants in 1968. Meanwhile, the number of housing of Le Morne-Rouge was 2 445 in 2007, 2 060 in 1999, 1 788 in 1990, 1 641 in 1982, 1 503 in 1975 and 1 389 in 1968.
The number of inhabitants of Le Morne-Rouge per housing was 2,11 in 2007.
|
Population of Le Morne-Rouge from 1968 to 2007 :
- Population of Le Morne-Rouge in 2007 : 5 170 inhabitants
- Population of Le Morne-Rouge in 1999 : 5 392 inhabitants
- Population of Le Morne-Rouge in 1990 : 5 278 inhabitants
- Population of Le Morne-Rouge in 1982 : 4 889 inhabitants
- Population of Le Morne-Rouge in 1975 : 5 412 inhabitants
- Population of Le Morne-Rouge in 1968 : 5 449 inhabitants
|
Number of inhabitants per housing of Le Morne-Rouge :
- Number of inhabitants per housing of Le Morne-Rouge in 2007 : 2,11
- Number of inhabitants per housing of Le Morne-Rouge in 1999 : 2,62
- Number of inhabitants per housing of Le Morne-Rouge in 1990 : 2,95
- Number of inhabitants per housing of Le Morne-Rouge in 1982 : 2,98
- Number of inhabitants per housing of Le Morne-Rouge in 1975 : 3,60
- Number of inhabitants per housing of Le Morne-Rouge in 1968 : 3,92
|
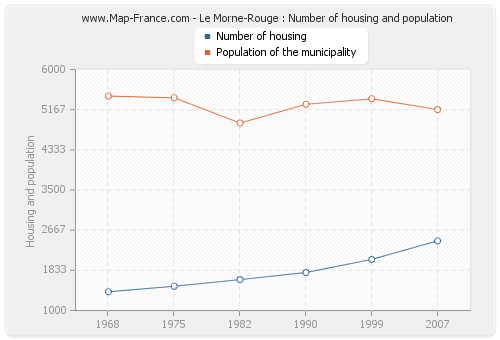
Number of inhabitants and housing of Le Morne-Rouge
|
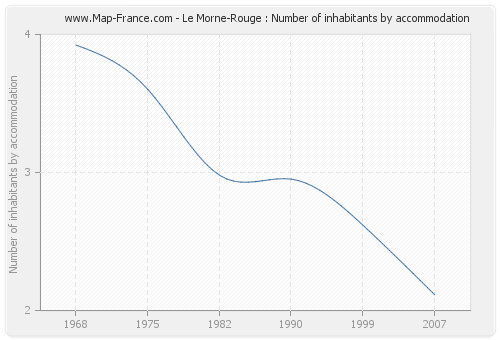
Number of inhabitants per housing of Le Morne-Rouge
|
Type of accommodation of Le Morne-Rouge
The accommodation of Le Morne-Rouge in 2007 consisted of 2 172 houses and 234 flats.
Here are below the graphs presenting the statistics of housing of Le Morne-Rouge.
|
Type of housing of Le Morne-Rouge in 2007 :
- Number of houses of Le Morne-Rouge in 2007 : 2 172
- Number of apartments of Le Morne-Rouge in 2007 : 234 |
Number of rooms of main homes of Le Morne-Rouge in 2007 :
- Number of main homes of Le Morne-Rouge of 1 room : 25
- Number of main homes of Le Morne-Rouge of 2 rooms : 156
- Number of main homes of Le Morne-Rouge of 3 rooms : 474
- Number of main homes of Le Morne-Rouge of 4 rooms : 474
- Number of main homes of Le Morne-Rouge of 5 rooms and more : 444 |
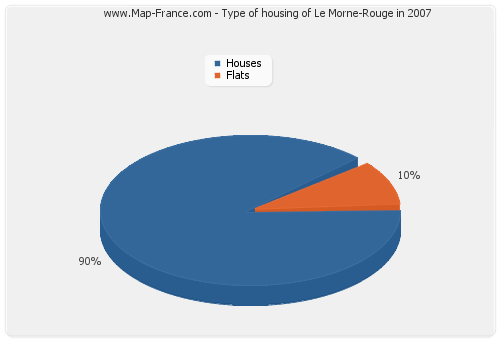
Type of housing of Le Morne-Rouge in 2007
|
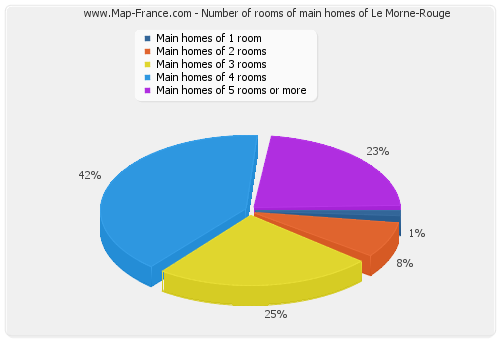
Number of rooms of main homes of Le Morne-Rouge
|
Type of housing of Le Morne-Rouge
|
In 2007, 1 277 main homes of Le Morne-Rouge were occupied by owners. Meanwhile, 1 901 households lived in the city of Le Morne-Rouge. The following graphs present the statistics of these households of Le Morne-Rouge.
|
Moving in date of the households of Le Morne-Rouge (2007 data):
- Number of households of Le Morne-Rouge having moved for less than 2 years : 241
- Number of households of Le Morne-Rouge having moved between 2 and 5 years : 275
- Number of households of Le Morne-Rouge having moved between 5 and 9 years : 341
- Number of households of Le Morne-Rouge having moved for 10 years or more : 1 043 |
Type of housing of the main homes of Le Morne-Rouge in 2007 :
- Number of main homes of Le Morne-Rouge occupied by owners : 1 277
- Number of main homes of Le Morne-Rouge occupied by tenants : 454
- Number of main homes of Le Morne-Rouge occupied free of charge : 169 |
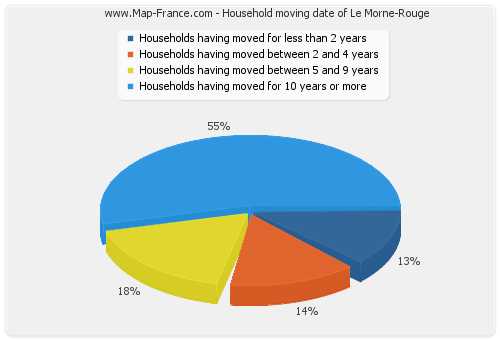
Household moving date of Le Morne-Rouge
|
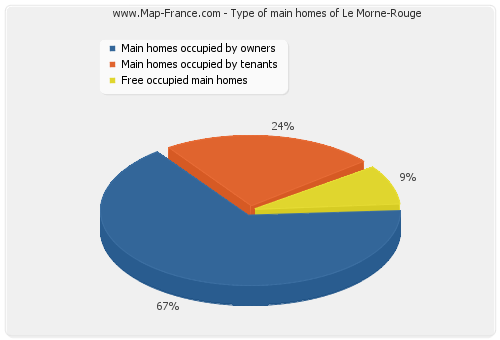
Type of main homes of Le Morne-Rouge
|
|
