Evolution of the number of housing of Les Billanges
History of housing of Les Billanges from 1968 to 2007 :
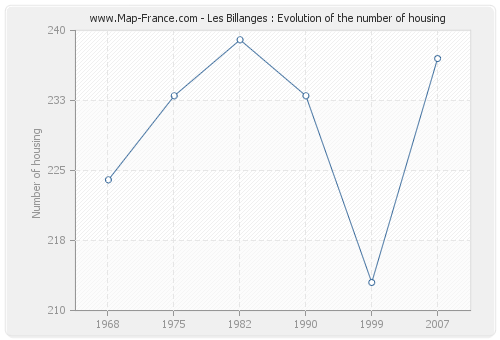
The number of housing of Les Billanges was 237 in 2007, 213 in 1999, 233 in 1990, 239 in 1982, 233 in 1975 and 224 in 1968.
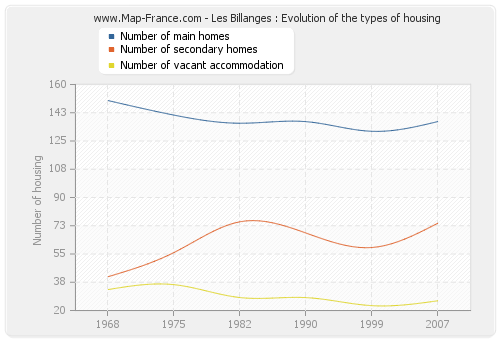
In 2007 the accommodations of Les Billanges consisted of 137 main homes, 74 second homes and 26 vacant accommodations.
The following graphs show the history of the number and the type of housing of Les Billanges from 1968 to 2007. The second graph is drawn in cubic interpolation. This allows to obtain more exactly the number of accommodation of the town of Les Billanges years where no inventory was made.
|
Housing of Les Billanges from 1968 to 2007 :
- Housing of Les Billanges in 2007 : 237
- Housing of Les Billanges in 1999 : 213
- Housing of Les Billanges in 1990 : 233
- Housing of Les Billanges in 1982 : 239
- Housing of Les Billanges in 1975 : 233
- Housing of Les Billanges in 1968 : 224
|
Number of housing of Les Billanges group by types from 1968 to 2007 :
- Number of main homes of Les Billanges in 2007 : 137
- Number of main homes of Les Billanges in 1999 : 131
- Number of main homes of Les Billanges in 1990 : 137
- Number of second homes of Les Billanges in 2007 : 74
- Number of second homes of Les Billanges in 1999 : 59
- Number of second homes of Les Billanges in 1990 : 68
- Number of vacant housing of Les Billanges in 2007 : 26
- Number of vacant housing of Les Billanges in 1999 : 23
- Number of vacant housing of Les Billanges in 1990 : 28
|
Housing of Les Billanges
|
Housing evolution of Les Billanges from 1968 to 2007
|
Number of housing of Les Billanges per inhabitants
History of the number of housing of Les Billanges per inhabitants :
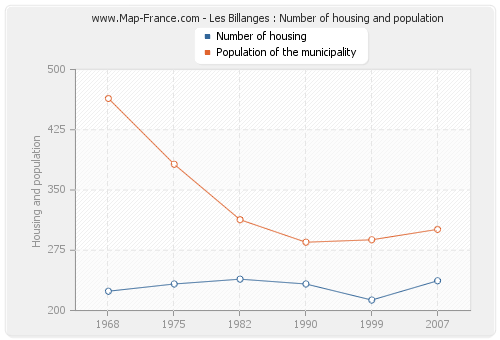
The population of Les Billanges was 301 inhabitants in 2007, 288 inhabitants in 1999, 285 inhabitants in 1990, 313 inhabitants in 1982, 382 inhabitants in 1975 and 464 inhabitants in 1968. Meanwhile, the number of housing of Les Billanges was 237 in 2007, 213 in 1999, 233 in 1990, 239 in 1982, 233 in 1975 and 224 in 1968.
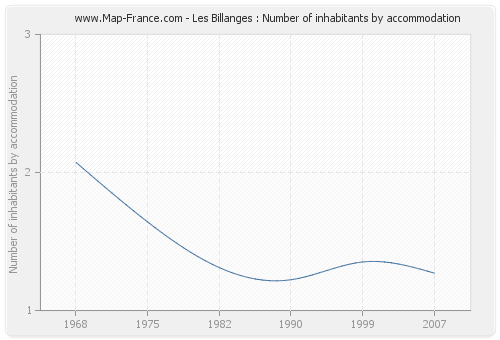
The number of inhabitants of Les Billanges per housing was 1,27 in 2007.
|
Population of Les Billanges from 1968 to 2007 :
- Population of Les Billanges in 2007 : 301 inhabitants
- Population of Les Billanges in 1999 : 288 inhabitants
- Population of Les Billanges in 1990 : 285 inhabitants
- Population of Les Billanges in 1982 : 313 inhabitants
- Population of Les Billanges in 1975 : 382 inhabitants
- Population of Les Billanges in 1968 : 464 inhabitants
|
Number of inhabitants per housing of Les Billanges :
- Number of inhabitants per housing of Les Billanges in 2007 : 1,27
- Number of inhabitants per housing of Les Billanges in 1999 : 1,35
- Number of inhabitants per housing of Les Billanges in 1990 : 1,22
- Number of inhabitants per housing of Les Billanges in 1982 : 1,31
- Number of inhabitants per housing of Les Billanges in 1975 : 1,64
- Number of inhabitants per housing of Les Billanges in 1968 : 2,07
|
Number of inhabitants and housing of Les Billanges
|
Number of inhabitants per housing of Les Billanges
|
Type of accommodation of Les Billanges
The accommodation of Les Billanges in 2007 consisted of 236 houses.
Here are below the graphs presenting the statistics of housing of Les Billanges.
|
Type of housing of Les Billanges in 2007 :
- Number of houses of Les Billanges in 2007 : 236
- Number of apartments of Les Billanges in 2007 : 0 |
Number of rooms of main homes of Les Billanges in 2007 :
- Number of main homes of Les Billanges of 1 room : 1
- Number of main homes of Les Billanges of 2 rooms : 8
- Number of main homes of Les Billanges of 3 rooms : 18
- Number of main homes of Les Billanges of 4 rooms : 18
- Number of main homes of Les Billanges of 5 rooms and more : 76 |
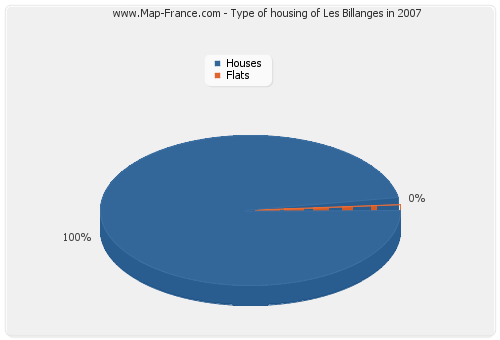
Type of housing of Les Billanges in 2007
|
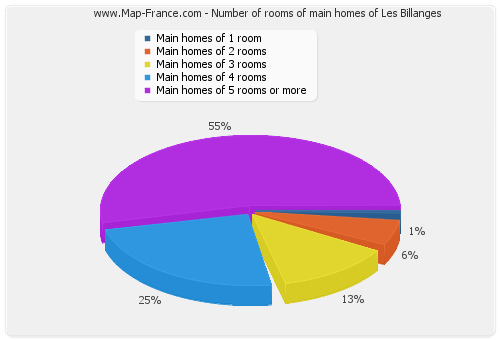
Number of rooms of main homes of Les Billanges
|
Type of housing of Les Billanges
|
In 2007, 123 main homes of Les Billanges were occupied by owners. Meanwhile, 137 households lived in the town of Les Billanges. The following graphs present the statistics of these households of Les Billanges.
|
Moving in date of the households of Les Billanges (2007 data):
- Number of households of Les Billanges having moved for less than 2 years : 9
- Number of households of Les Billanges having moved between 2 and 5 years : 25
- Number of households of Les Billanges having moved between 5 and 9 years : 15
- Number of households of Les Billanges having moved for 10 years or more : 88 |
Type of housing of the main homes of Les Billanges in 2007 :
- Number of main homes of Les Billanges occupied by owners : 123
- Number of main homes of Les Billanges occupied by tenants : 8
- Number of main homes of Les Billanges occupied free of charge : 6 |
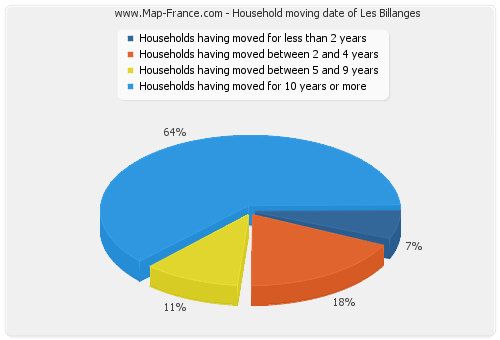
Household moving date of Les Billanges
|
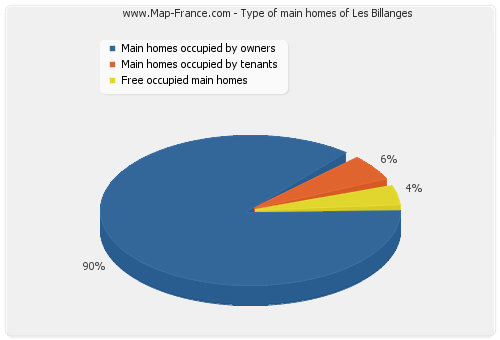
Type of main homes of Les Billanges
|
|
