|
|
|
|
|
|
Mirabel-aux-Baronnies population statistics
|
|
|
|
Historical data of the population of Mirabel-aux-Baronnies from 1968 to 2007
Historical data of the population of Mirabel-aux-Baronnies from 1968 to 2007 :
Population of Mirabel-aux-Baronnies was 1 512 inhabitants in 2007, 1 328 inhabitants in 1999, 1 276 inhabitants in 1990, 1 048 inhabitants in 1982, 901 inhabitants in 1975 and 886 inhabitants in 1968.
This population Census of the town of Mirabel-aux-Baronnies was made without duplicated data, which means that each Mirabel-aux-Baronnies resident that have ties to another municipality is counted only once for the two municipalities.
|
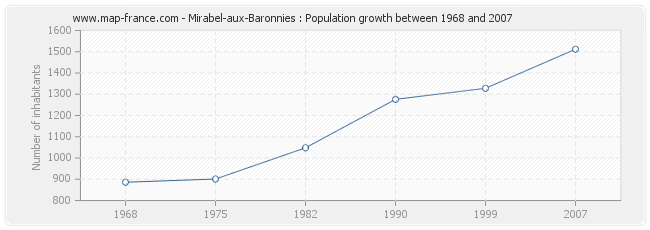
Population Mirabel-aux-Baronnies
|
Population distribution of Mirabel-aux-Baronnies by sexe
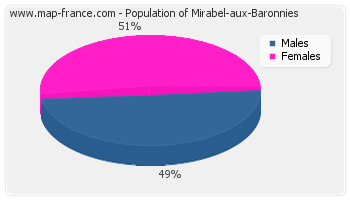
Population distribution of Mirabel-aux-Baronnies by sexe :
- Men inhabitants Mirabel-aux-Baronnies in 2007 were 740
- Women inhabitants in 2007 were 772
|
|
Evolution of the population of Mirabel-aux-Baronnies
|
Population of Mirabel-aux-Baronnies from 1968 to 2007 :
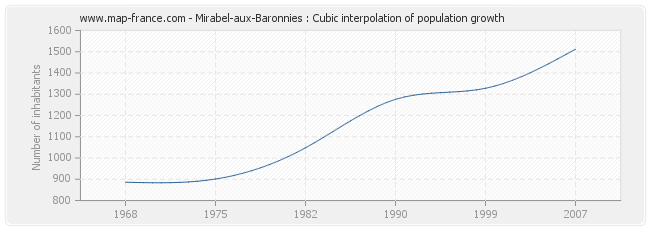
This curve shows the history of the population of Mirabel-aux-Baronnies from 1968 to 2007 in cubic interpolation. This provides more precisely the population of the municipality of Mirabel-aux-Baronnies the years where no census has been taken.
- Population of Mirabel-aux-Baronnies in 2007 : 1 512 inhabitants
- Population of Mirabel-aux-Baronnies in 1999 : 1 328 inhabitants
- Population of Mirabel-aux-Baronnies in 1990 : 1 276 inhabitants
- Population of Mirabel-aux-Baronnies in 1982 : 1 048 inhabitants
- Population of Mirabel-aux-Baronnies in 1975 : 901 inhabitants
- Population of Mirabel-aux-Baronnies in 1968 : 886 inhabitants
|
|
Mirabel-aux-Baronnies : births and deaths
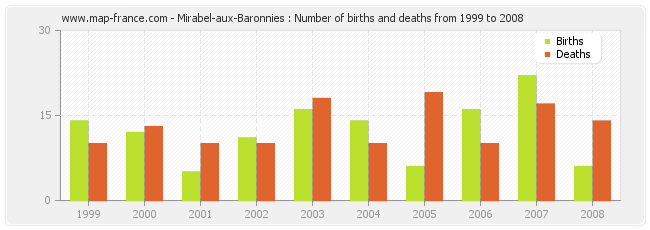
Mirabel-aux-Baronnies : births and deaths from 1999 to 2008
- Mirabel-aux-Baronnies in 2008 : 6 births and 14 deaths
- Mirabel-aux-Baronnies in 2007 : 22 births and 17 deaths
- Mirabel-aux-Baronnies in 2006 : 16 births and 10 deaths
- Mirabel-aux-Baronnies in 2005 : 6 births and 19 deaths
- Mirabel-aux-Baronnies in 2004 : 14 births and 10 deaths
- Mirabel-aux-Baronnies in 2003 : 16 births and 18 deaths
- Mirabel-aux-Baronnies in 2002 : 11 births and 10 deaths
- Mirabel-aux-Baronnies in 2001 : 5 births and 10 deaths
- Mirabel-aux-Baronnies in 2000 : 12 births and 13 deaths
- Mirabel-aux-Baronnies in 1999 : 14 births and 10 deaths
|
|
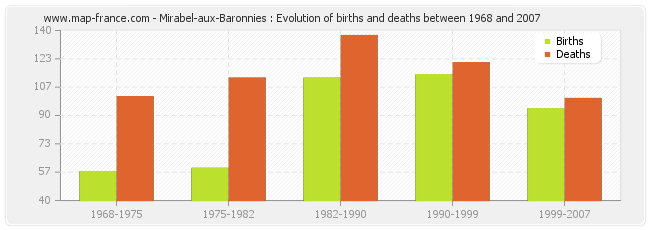
Mirabel-aux-Baronnies : evolution of births and deaths from 1968 to 2007
- From 1999 and 2007 : 94 births and 100 deaths.
- From 1990 and 1999 : 114 births and 121 deaths.
- From 1982 and 1990 : 112 births and 137 deaths.
- From 1975 and 1982 : 59 births and 112 deaths.
- From 1968 and 1975 : 57 births and 101 deaths.
|
|
Distribution of the population of Mirabel-aux-Baronnies by age
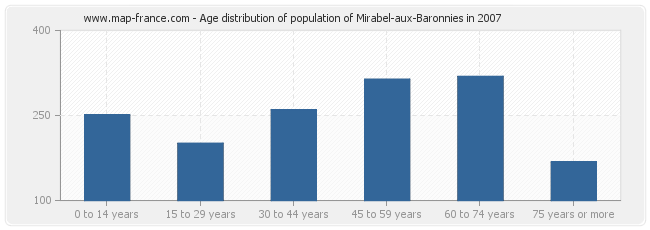
Distribution of the population of Mirabel-aux-Baronnies by age in 2007 :
- Population of Mirabel-aux-Baronnies from 0 to 14 years : 251 inhabitants
- Population of Mirabel-aux-Baronnies from 15 to 29 years : 201 inhabitants
- Population of Mirabel-aux-Baronnies from 30 to 44 years : 260 inhabitants
- Population of Mirabel-aux-Baronnies from 45 to 59 years : 314 inhabitants
- Population of Mirabel-aux-Baronnies from 60 to 74 years : 319 inhabitants
- Population of Mirabel-aux-Baronnies from 75 years or more : 168 inhabitants
|
|
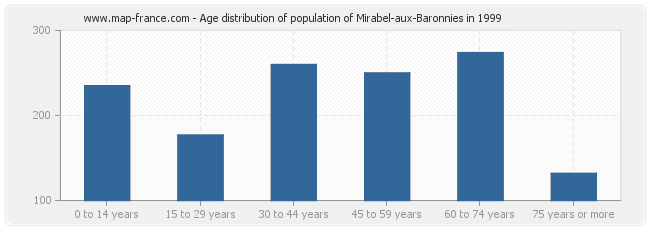
Distribution of the population of Mirabel-aux-Baronnies by age in 1999 :
- Population of Mirabel-aux-Baronnies from 0 to 14 years : 235 inhabitants
- Population of Mirabel-aux-Baronnies from 15 to 29 years : 177 inhabitants
- Population of Mirabel-aux-Baronnies from 30 to 44 years : 260 inhabitants
- Population of Mirabel-aux-Baronnies from 45 to 59 years : 250 inhabitants
- Population of Mirabel-aux-Baronnies from 60 to 74 years : 274 inhabitants
- Population of Mirabel-aux-Baronnies from 75 years or more : 132 inhabitants
|
|
Men population of Mirabel-aux-Baronnies in 2007
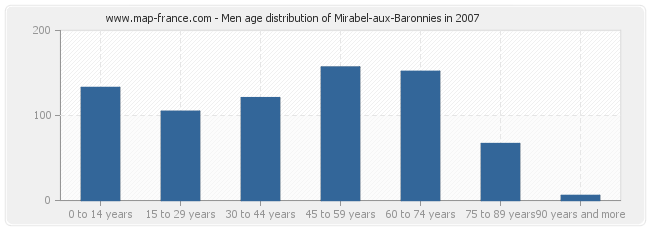
Men population distribution of Mirabel-aux-Baronnies by age in 2007 :
- Mirabel-aux-Baronnies men inhabitants from 0 to 14 years : 133
- Mirabel-aux-Baronnies men inhabitants from 15 to 29 years : 105
- Mirabel-aux-Baronnies men inhabitants from 30 to 44 years : 121
- Mirabel-aux-Baronnies men inhabitants from 45 to 59 years : 157
- Mirabel-aux-Baronnies men inhabitants from 60 to 74 years : 152
- Mirabel-aux-Baronnies men inhabitants from 75 to 90 years : 67
- Mirabel-aux-Baronnies men inhabitants of 90 years and more : 6
|
|
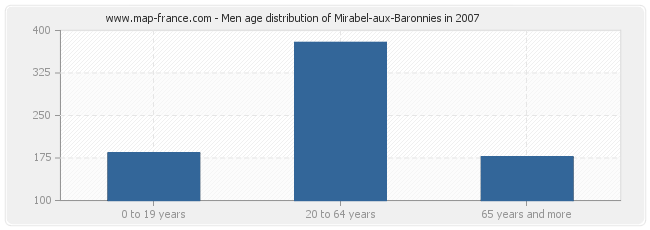
Men population distribution of Mirabel-aux-Baronnies by age in 2007 :
- Mirabel-aux-Baronnies men inhabitants from 0 to 19 years : 184
- Mirabel-aux-Baronnies men inhabitants from 20 to 64 years : 379
- Mirabel-aux-Baronnies men inhabitants of 65 years and more : 177
|
|
Population féminine of Mirabel-aux-Baronnies in 2007
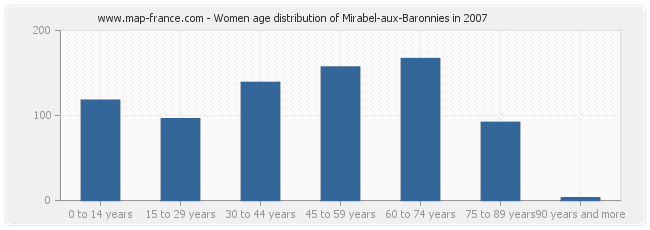
Women population distribution of Mirabel-aux-Baronnies by age in 2007 :
- Mirabel-aux-Baronnies women inhabitants from 0 to 14 years : 118
- Mirabel-aux-Baronnies women inhabitants from 15 to 29 years : 96
- Mirabel-aux-Baronnies women inhabitants from 30 to 44 years : 139
- Mirabel-aux-Baronnies women inhabitants from 45 to 59 years : 157
- Mirabel-aux-Baronnies women inhabitants from 60 to 74 years : 167
- Mirabel-aux-Baronnies women inhabitants from 75 to 90 years : 92
- Mirabel-aux-Baronnies women inhabitants of 90 years and more : 3
|
|
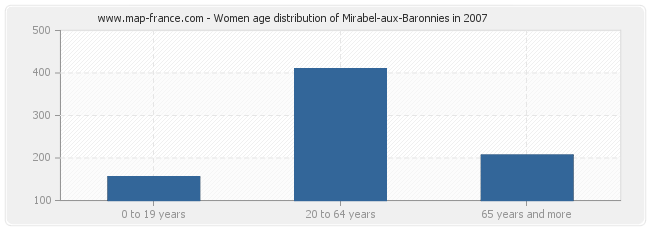
Women population distribution of Mirabel-aux-Baronnies by age in 2007 :
- Mirabel-aux-Baronnies women inhabitants from 0 to 19 years : 156
- Mirabel-aux-Baronnies women inhabitants from 20 to 64 years : 410
- Mirabel-aux-Baronnies women inhabitants of 65 years and more : 207
|
|
|
Other population statistics, maps, hotels of towns in france
Find the population data of another town, zip code, department, region, ...
Quick links Mirabel-aux-Baronnies :
Back to the menus Map of France :
Make a link to this page of Mirabel-aux-Baronnies with the following code :
|
|
Map of France | Regions | Departments | Cities | Partners | Terms | Contact
|
