|
|
|
|
|
|
Plestin-les-Greves population statistics
|
|
|
|
Historical data of the population of Plestin-les-Grèves from 1968 to 2007
Historical data of the population of Plestin-les-Grèves from 1968 to 2007 :
Population of Plestin-les-Grèves was 3 701 inhabitants in 2007, 3 413 inhabitants in 1999, 3 237 inhabitants in 1990, 3 222 inhabitants in 1982, 3 018 inhabitants in 1975 and 2 912 inhabitants in 1968.
This population Census of the city of Plestin-les-Grèves was made without duplicated data, which means that each Plestin-les-Grèves resident that have ties to another municipality is counted only once for the two municipalities.
|
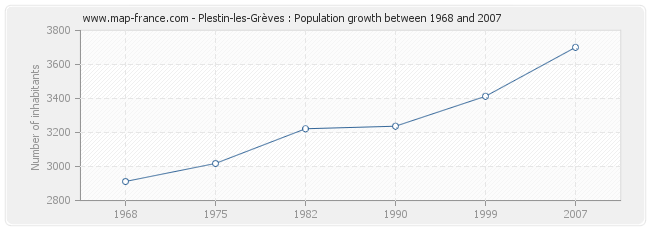
Population Plestin-les-Grèves
|
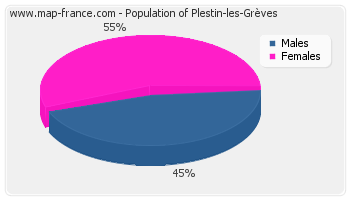
Population distribution of Plestin-les-Grèves by sexe
Population distribution of Plestin-les-Grèves by sexe :
- Men inhabitants Plestin-les-Grèves in 2007 were 1 662
- Women inhabitants in 2007 were 2 038
|
|
Evolution of the population of Plestin-les-Grèves
|
Population of Plestin-les-Grèves from 1968 to 2007 :
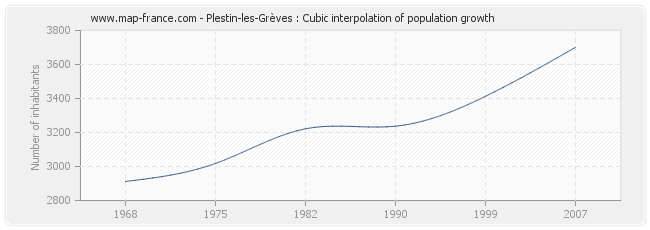
This curve shows the history of the population of Plestin-les-Grèves from 1968 to 2007 in cubic interpolation. This provides more precisely the population of the municipality of Plestin-les-Grèves the years where no census has been taken.
- Population of Plestin-les-Grèves in 2007 : 3 701 inhabitants
- Population of Plestin-les-Grèves in 1999 : 3 413 inhabitants
- Population of Plestin-les-Grèves in 1990 : 3 237 inhabitants
- Population of Plestin-les-Grèves in 1982 : 3 222 inhabitants
- Population of Plestin-les-Grèves in 1975 : 3 018 inhabitants
- Population of Plestin-les-Grèves in 1968 : 2 912 inhabitants
|
|
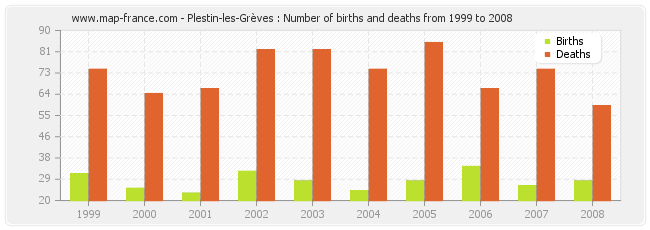
Plestin-les-Grèves : births and deaths
Plestin-les-Grèves : births and deaths from 1999 to 2008
- Plestin-les-Grèves in 2008 : 28 births and 59 deaths
- Plestin-les-Grèves in 2007 : 26 births and 74 deaths
- Plestin-les-Grèves in 2006 : 34 births and 66 deaths
- Plestin-les-Grèves in 2005 : 28 births and 85 deaths
- Plestin-les-Grèves in 2004 : 24 births and 74 deaths
- Plestin-les-Grèves in 2003 : 28 births and 82 deaths
- Plestin-les-Grèves in 2002 : 32 births and 82 deaths
- Plestin-les-Grèves in 2001 : 23 births and 66 deaths
- Plestin-les-Grèves in 2000 : 25 births and 64 deaths
- Plestin-les-Grèves in 1999 : 31 births and 74 deaths
|
|
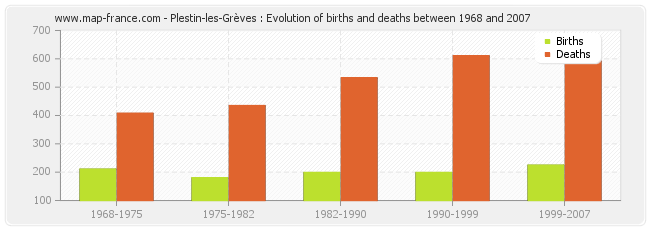
Plestin-les-Grèves : evolution of births and deaths from 1968 to 2007
- From 1999 and 2007 : 225 births and 593 deaths.
- From 1990 and 1999 : 199 births and 611 deaths.
- From 1982 and 1990 : 199 births and 533 deaths.
- From 1975 and 1982 : 180 births and 435 deaths.
- From 1968 and 1975 : 211 births and 408 deaths.
|
|
Distribution of the population of Plestin-les-Grèves by age
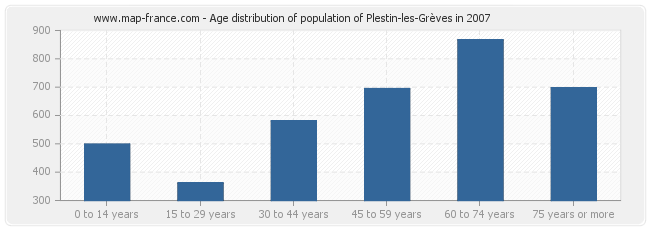
Distribution of the population of Plestin-les-Grèves by age in 2007 :
- Population of Plestin-les-Grèves from 0 to 14 years : 499 inhabitants
- Population of Plestin-les-Grèves from 15 to 29 years : 362 inhabitants
- Population of Plestin-les-Grèves from 30 to 44 years : 581 inhabitants
- Population of Plestin-les-Grèves from 45 to 59 years : 695 inhabitants
- Population of Plestin-les-Grèves from 60 to 74 years : 867 inhabitants
- Population of Plestin-les-Grèves from 75 years or more : 698 inhabitants
|
|
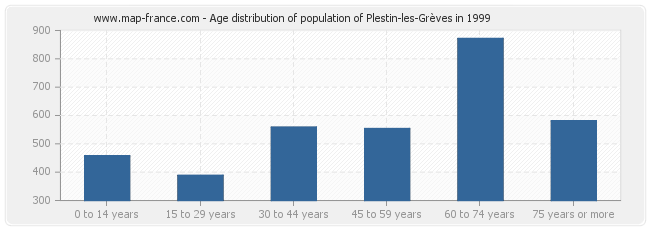
Distribution of the population of Plestin-les-Grèves by age in 1999 :
- Population of Plestin-les-Grèves from 0 to 14 years : 458 inhabitants
- Population of Plestin-les-Grèves from 15 to 29 years : 389 inhabitants
- Population of Plestin-les-Grèves from 30 to 44 years : 559 inhabitants
- Population of Plestin-les-Grèves from 45 to 59 years : 554 inhabitants
- Population of Plestin-les-Grèves from 60 to 74 years : 872 inhabitants
- Population of Plestin-les-Grèves from 75 years or more : 581 inhabitants
|
|
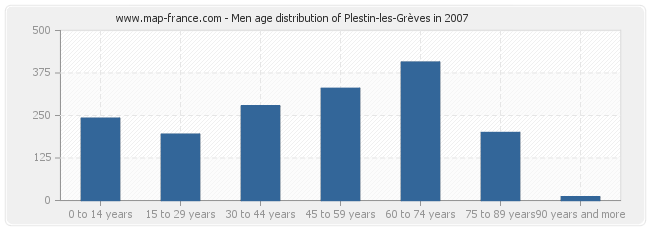
Men population of Plestin-les-Grèves in 2007
Men population distribution of Plestin-les-Grèves by age in 2007 :
- Plestin-les-Grèves men inhabitants from 0 to 14 years : 242
- Plestin-les-Grèves men inhabitants from 15 to 29 years : 195
- Plestin-les-Grèves men inhabitants from 30 to 44 years : 278
- Plestin-les-Grèves men inhabitants from 45 to 59 years : 330
- Plestin-les-Grèves men inhabitants from 60 to 74 years : 407
- Plestin-les-Grèves men inhabitants from 75 to 90 years : 200
- Plestin-les-Grèves men inhabitants of 90 years and more : 11
|
|
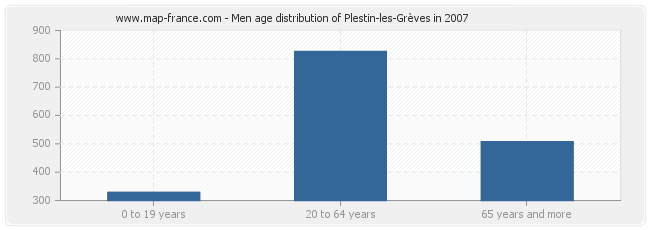
Men population distribution of Plestin-les-Grèves by age in 2007 :
- Plestin-les-Grèves men inhabitants from 0 to 19 years : 329
- Plestin-les-Grèves men inhabitants from 20 to 64 years : 826
- Plestin-les-Grèves men inhabitants of 65 years and more : 507
|
|
Population féminine of Plestin-les-Grèves in 2007
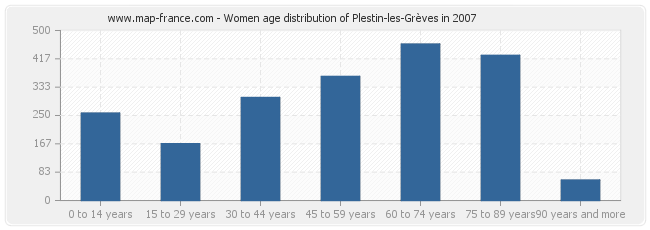
Women population distribution of Plestin-les-Grèves by age in 2007 :
- Plestin-les-Grèves women inhabitants from 0 to 14 years : 257
- Plestin-les-Grèves women inhabitants from 15 to 29 years : 167
- Plestin-les-Grèves women inhabitants from 30 to 44 years : 303
- Plestin-les-Grèves women inhabitants from 45 to 59 years : 365
- Plestin-les-Grèves women inhabitants from 60 to 74 years : 460
- Plestin-les-Grèves women inhabitants from 75 to 90 years : 427
- Plestin-les-Grèves women inhabitants of 90 years and more : 60
|
|
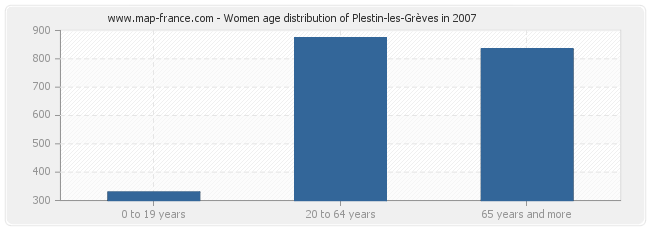
Women population distribution of Plestin-les-Grèves by age in 2007 :
- Plestin-les-Grèves women inhabitants from 0 to 19 years : 330
- Plestin-les-Grèves women inhabitants from 20 to 64 years : 874
- Plestin-les-Grèves women inhabitants of 65 years and more : 835
|
|
|
Other population statistics, maps, hotels of towns in france
Find the population data of another town, zip code, department, region, ...
Quick links Plestin-les-Grèves :
Back to the menus Map of France :
Make a link to this page of Plestin-les-Grèves with the following code :
|
|
Map of France | Regions | Departments | Cities | Partners | Terms | Contact
|
