|
|
|
|
|
|
Ribecourt-Dreslincourt population statistics
|
|
|
|
Historical data of the population of Ribécourt-Dreslincourt from 1968 to 2007
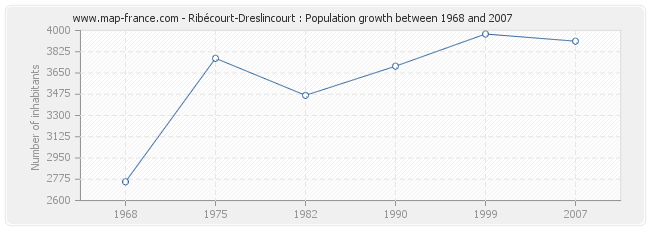
Historical data of the population of Ribécourt-Dreslincourt from 1968 to 2007 :
Population of Ribécourt-Dreslincourt was 3 912 inhabitants in 2007, 3 971 inhabitants in 1999, 3 706 inhabitants in 1990, 3 466 inhabitants in 1982, 3 771 inhabitants in 1975 and 2 754 inhabitants in 1968.
This population Census of the city of Ribécourt-Dreslincourt was made without duplicated data, which means that each Ribécourt-Dreslincourt resident that have ties to another municipality is counted only once for the two municipalities.
|
Population Ribécourt-Dreslincourt
|
Population distribution of Ribécourt-Dreslincourt by sexe
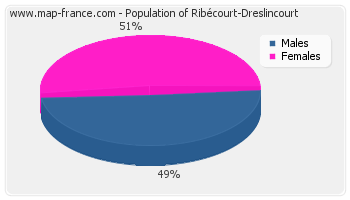
Population distribution of Ribécourt-Dreslincourt by sexe :
- Men inhabitants Ribécourt-Dreslincourt in 2007 were 1 924
- Women inhabitants in 2007 were 1 988
|
|
Evolution of the population of Ribécourt-Dreslincourt
|
Population of Ribécourt-Dreslincourt from 1968 to 2007 :
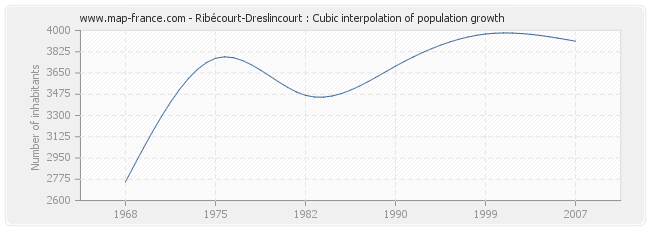
This curve shows the history of the population of Ribécourt-Dreslincourt from 1968 to 2007 in cubic interpolation. This provides more precisely the population of the municipality of Ribécourt-Dreslincourt the years where no census has been taken.
- Population of Ribécourt-Dreslincourt in 2007 : 3 912 inhabitants
- Population of Ribécourt-Dreslincourt in 1999 : 3 971 inhabitants
- Population of Ribécourt-Dreslincourt in 1990 : 3 706 inhabitants
- Population of Ribécourt-Dreslincourt in 1982 : 3 466 inhabitants
- Population of Ribécourt-Dreslincourt in 1975 : 3 771 inhabitants
- Population of Ribécourt-Dreslincourt in 1968 : 2 754 inhabitants
|
|
Ribécourt-Dreslincourt : births and deaths
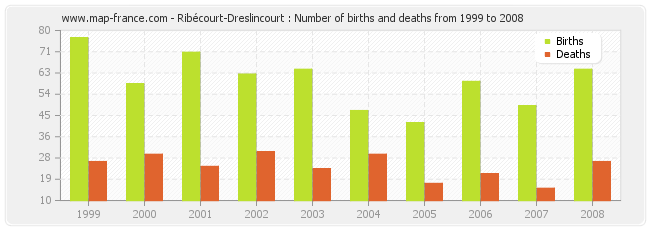
Ribécourt-Dreslincourt : births and deaths from 1999 to 2008
- Ribécourt-Dreslincourt in 2008 : 64 births and 26 deaths
- Ribécourt-Dreslincourt in 2007 : 49 births and 15 deaths
- Ribécourt-Dreslincourt in 2006 : 59 births and 21 deaths
- Ribécourt-Dreslincourt in 2005 : 42 births and 17 deaths
- Ribécourt-Dreslincourt in 2004 : 47 births and 29 deaths
- Ribécourt-Dreslincourt in 2003 : 64 births and 23 deaths
- Ribécourt-Dreslincourt in 2002 : 62 births and 30 deaths
- Ribécourt-Dreslincourt in 2001 : 71 births and 24 deaths
- Ribécourt-Dreslincourt in 2000 : 58 births and 29 deaths
- Ribécourt-Dreslincourt in 1999 : 77 births and 26 deaths
|
|
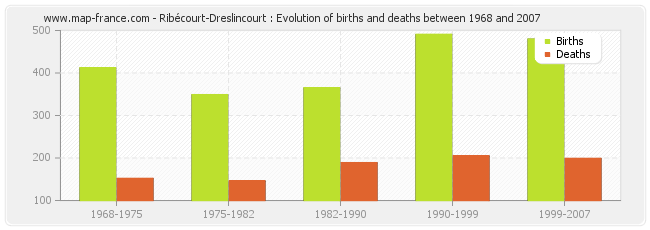
Ribécourt-Dreslincourt : evolution of births and deaths from 1968 to 2007
- From 1999 and 2007 : 480 births and 199 deaths.
- From 1990 and 1999 : 491 births and 205 deaths.
- From 1982 and 1990 : 365 births and 189 deaths.
- From 1975 and 1982 : 349 births and 146 deaths.
- From 1968 and 1975 : 412 births and 152 deaths.
|
|
Distribution of the population of Ribécourt-Dreslincourt by age
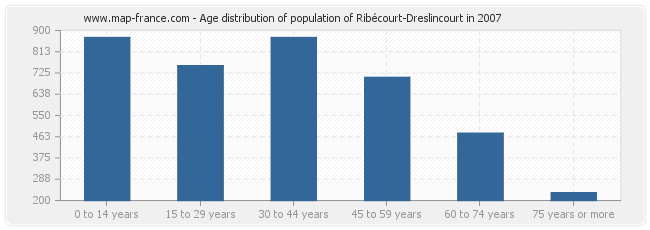
Distribution of the population of Ribécourt-Dreslincourt by age in 2007 :
- Population of Ribécourt-Dreslincourt from 0 to 14 years : 871 inhabitants
- Population of Ribécourt-Dreslincourt from 15 to 29 years : 755 inhabitants
- Population of Ribécourt-Dreslincourt from 30 to 44 years : 871 inhabitants
- Population of Ribécourt-Dreslincourt from 45 to 59 years : 707 inhabitants
- Population of Ribécourt-Dreslincourt from 60 to 74 years : 477 inhabitants
- Population of Ribécourt-Dreslincourt from 75 years or more : 231 inhabitants
|
|
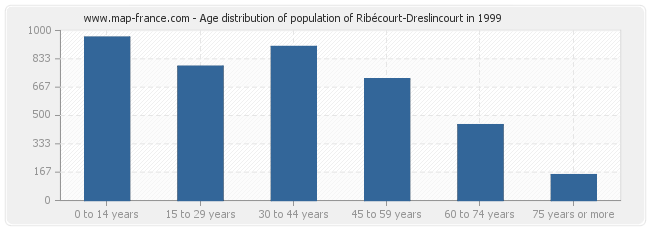
Distribution of the population of Ribécourt-Dreslincourt by age in 1999 :
- Population of Ribécourt-Dreslincourt from 0 to 14 years : 961 inhabitants
- Population of Ribécourt-Dreslincourt from 15 to 29 years : 790 inhabitants
- Population of Ribécourt-Dreslincourt from 30 to 44 years : 906 inhabitants
- Population of Ribécourt-Dreslincourt from 45 to 59 years : 716 inhabitants
- Population of Ribécourt-Dreslincourt from 60 to 74 years : 446 inhabitants
- Population of Ribécourt-Dreslincourt from 75 years or more : 152 inhabitants
|
|
Men population of Ribécourt-Dreslincourt in 2007
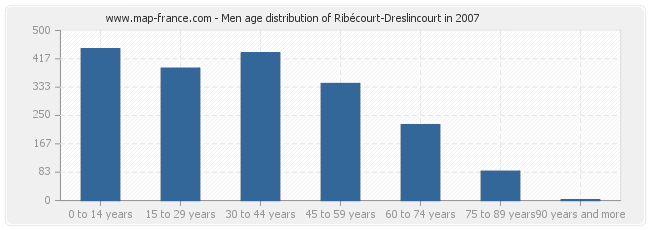
Men population distribution of Ribécourt-Dreslincourt by age in 2007 :
- Ribécourt-Dreslincourt men inhabitants from 0 to 14 years : 446
- Ribécourt-Dreslincourt men inhabitants from 15 to 29 years : 389
- Ribécourt-Dreslincourt men inhabitants from 30 to 44 years : 434
- Ribécourt-Dreslincourt men inhabitants from 45 to 59 years : 344
- Ribécourt-Dreslincourt men inhabitants from 60 to 74 years : 223
- Ribécourt-Dreslincourt men inhabitants from 75 to 90 years : 86
- Ribécourt-Dreslincourt men inhabitants of 90 years and more : 2
|
|
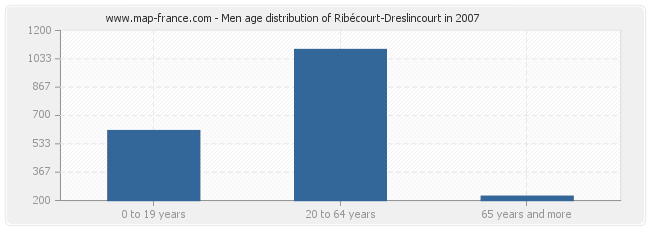
Men population distribution of Ribécourt-Dreslincourt by age in 2007 :
- Ribécourt-Dreslincourt men inhabitants from 0 to 19 years : 611
- Ribécourt-Dreslincourt men inhabitants from 20 to 64 years : 1 088
- Ribécourt-Dreslincourt men inhabitants of 65 years and more : 225
|
|
Population féminine of Ribécourt-Dreslincourt in 2007
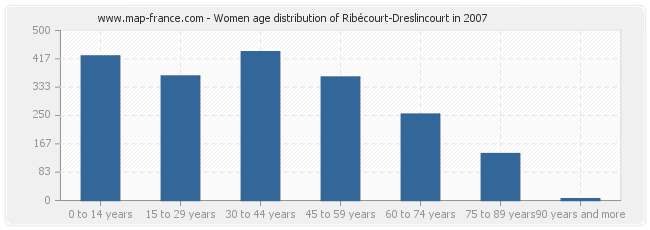
Women population distribution of Ribécourt-Dreslincourt by age in 2007 :
- Ribécourt-Dreslincourt women inhabitants from 0 to 14 years : 425
- Ribécourt-Dreslincourt women inhabitants from 15 to 29 years : 366
- Ribécourt-Dreslincourt women inhabitants from 30 to 44 years : 437
- Ribécourt-Dreslincourt women inhabitants from 45 to 59 years : 363
- Ribécourt-Dreslincourt women inhabitants from 60 to 74 years : 254
- Ribécourt-Dreslincourt women inhabitants from 75 to 90 years : 138
- Ribécourt-Dreslincourt women inhabitants of 90 years and more : 5
|
|
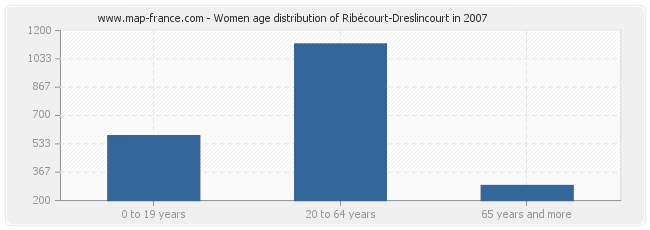
Women population distribution of Ribécourt-Dreslincourt by age in 2007 :
- Ribécourt-Dreslincourt women inhabitants from 0 to 19 years : 580
- Ribécourt-Dreslincourt women inhabitants from 20 to 64 years : 1 120
- Ribécourt-Dreslincourt women inhabitants of 65 years and more : 288
|
|
|
Other population statistics, maps, hotels of towns in france
Find the population data of another town, zip code, department, region, ...
Quick links Ribécourt-Dreslincourt :
Back to the menus Map of France :
Make a link to this page of Ribécourt-Dreslincourt with the following code :
|
|
Map of France | Regions | Departments | Cities | Partners | Terms | Contact
|
