|
|
|
|
|
|
Verargues population statistics
|
|
|
|
Historical data of the population of Vérargues from 1968 to 2007
Historical data of the population of Vérargues from 1968 to 2007 :
Population of Vérargues was 681 inhabitants in 2007, 446 inhabitants in 1999, 524 inhabitants in 1990, 291 inhabitants in 1982, 348 inhabitants in 1975 and 308 inhabitants in 1968.
This population Census of the town of Vérargues was made without duplicated data, which means that each Vérargues resident that have ties to another municipality is counted only once for the two municipalities.
|
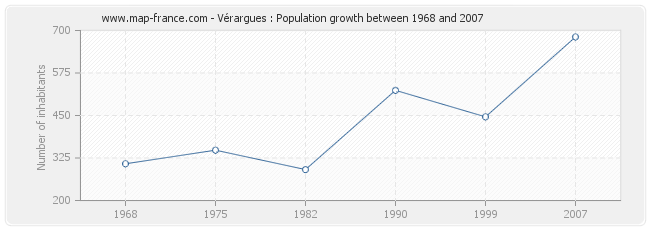
Population Vérargues
|
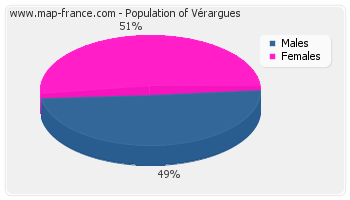
Population distribution of Vérargues by sexe
Population distribution of Vérargues by sexe :
- Men inhabitants Vérargues in 2007 were 334
- Women inhabitants in 2007 were 347
|
|
Evolution of the population of Vérargues
|
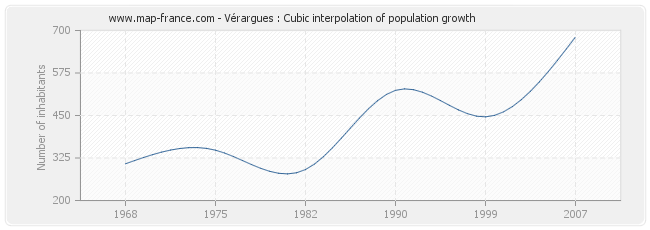
Population of Vérargues from 1968 to 2007 :
This curve shows the history of the population of Vérargues from 1968 to 2007 in cubic interpolation. This provides more precisely the population of the municipality of Vérargues the years where no census has been taken.
- Population of Vérargues in 2007 : 681 inhabitants
- Population of Vérargues in 1999 : 446 inhabitants
- Population of Vérargues in 1990 : 524 inhabitants
- Population of Vérargues in 1982 : 291 inhabitants
- Population of Vérargues in 1975 : 348 inhabitants
- Population of Vérargues in 1968 : 308 inhabitants
|
|
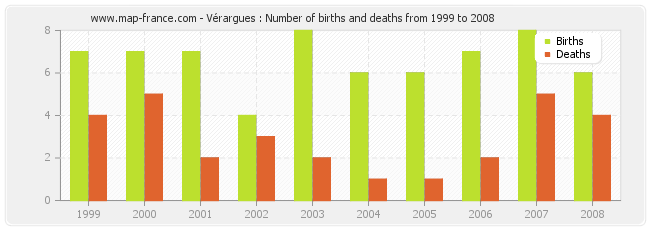
Vérargues : births and deaths
Vérargues : births and deaths from 1999 to 2008
- Vérargues in 2008 : 6 births and 4 deaths
- Vérargues in 2007 : 8 births and 5 deaths
- Vérargues in 2006 : 7 births and 2 deaths
- Vérargues in 2005 : 6 births and 1 deaths
- Vérargues in 2004 : 6 births and 1 deaths
- Vérargues in 2003 : 8 births and 2 deaths
- Vérargues in 2002 : 4 births and 3 deaths
- Vérargues in 2001 : 7 births and 2 deaths
- Vérargues in 2000 : 7 births and 5 deaths
- Vérargues in 1999 : 7 births and 4 deaths
|
|
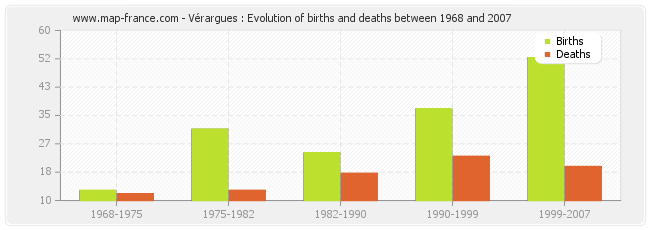
Vérargues : evolution of births and deaths from 1968 to 2007
- From 1999 and 2007 : 52 births and 20 deaths.
- From 1990 and 1999 : 37 births and 23 deaths.
- From 1982 and 1990 : 24 births and 18 deaths.
- From 1975 and 1982 : 31 births and 13 deaths.
- From 1968 and 1975 : 13 births and 12 deaths.
|
|
Distribution of the population of Vérargues by age
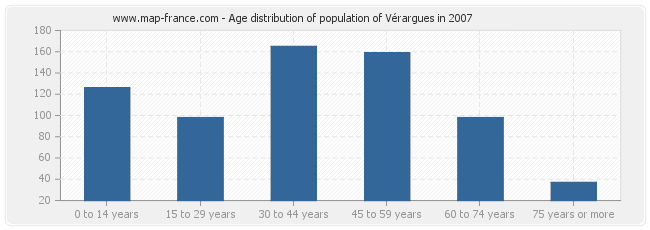
Distribution of the population of Vérargues by age in 2007 :
- Population of Vérargues from 0 to 14 years : 126 inhabitants
- Population of Vérargues from 15 to 29 years : 98 inhabitants
- Population of Vérargues from 30 to 44 years : 165 inhabitants
- Population of Vérargues from 45 to 59 years : 159 inhabitants
- Population of Vérargues from 60 to 74 years : 98 inhabitants
- Population of Vérargues from 75 years or more : 37 inhabitants
|
|
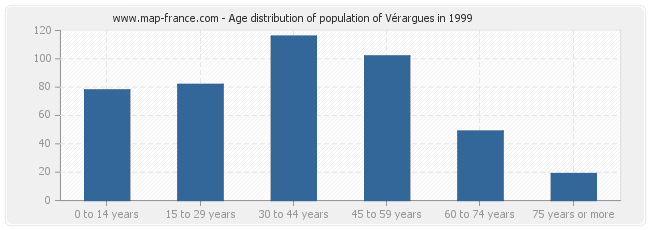
Distribution of the population of Vérargues by age in 1999 :
- Population of Vérargues from 0 to 14 years : 78 inhabitants
- Population of Vérargues from 15 to 29 years : 82 inhabitants
- Population of Vérargues from 30 to 44 years : 116 inhabitants
- Population of Vérargues from 45 to 59 years : 102 inhabitants
- Population of Vérargues from 60 to 74 years : 49 inhabitants
- Population of Vérargues from 75 years or more : 19 inhabitants
|
|
Men population of Vérargues in 2007
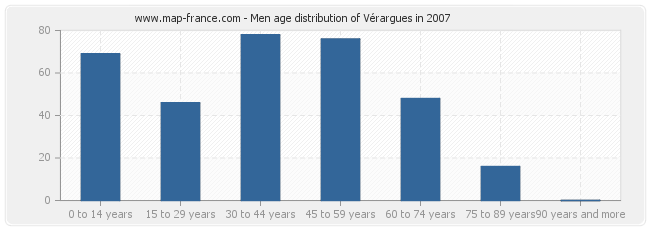
Men population distribution of Vérargues by age in 2007 :
- Vérargues men inhabitants from 0 to 14 years : 69
- Vérargues men inhabitants from 15 to 29 years : 46
- Vérargues men inhabitants from 30 to 44 years : 78
- Vérargues men inhabitants from 45 to 59 years : 76
- Vérargues men inhabitants from 60 to 74 years : 48
- Vérargues men inhabitants from 75 to 90 years : 16
- Vérargues men inhabitants of 90 years and more : 0
|
|
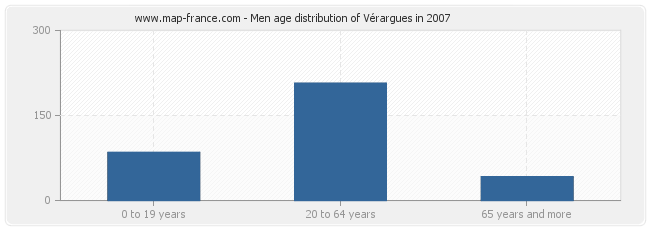
Men population distribution of Vérargues by age in 2007 :
- Vérargues men inhabitants from 0 to 19 years : 85
- Vérargues men inhabitants from 20 to 64 years : 207
- Vérargues men inhabitants of 65 years and more : 42
|
|
Population féminine of Vérargues in 2007
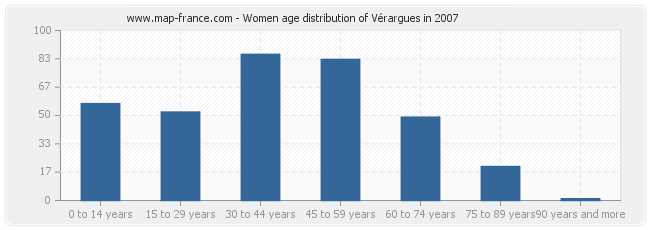
Women population distribution of Vérargues by age in 2007 :
- Vérargues women inhabitants from 0 to 14 years : 57
- Vérargues women inhabitants from 15 to 29 years : 52
- Vérargues women inhabitants from 30 to 44 years : 86
- Vérargues women inhabitants from 45 to 59 years : 83
- Vérargues women inhabitants from 60 to 74 years : 49
- Vérargues women inhabitants from 75 to 90 years : 20
- Vérargues women inhabitants of 90 years and more : 1
|
|
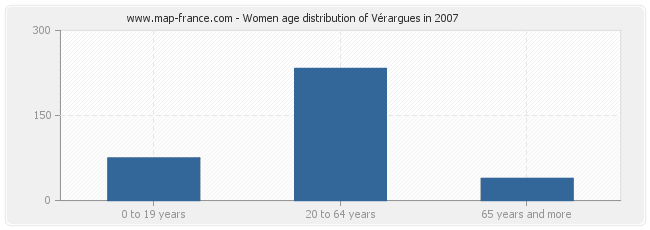
Women population distribution of Vérargues by age in 2007 :
- Vérargues women inhabitants from 0 to 19 years : 75
- Vérargues women inhabitants from 20 to 64 years : 233
- Vérargues women inhabitants of 65 years and more : 39
|
|
|
Other population statistics, maps, hotels of towns in france
Find the population data of another town, zip code, department, region, ...
Quick links Vérargues :
Back to the menus Map of France :
Make a link to this page of Vérargues with the following code :
|
|
Map of France | Regions | Departments | Cities | Partners | Terms | Contact
|
